
Problem
For this project we will be exploring the publicly available data from LendingClub.com. Lending Club connects people who need money (borrowers) with people who have money (investors). As an investor one would want to invest in people who showed a profile of having a high probability of paying the amount back. Using Decision Tree model, classify whether or not the borrower paid back their loan in full.
About Dataset
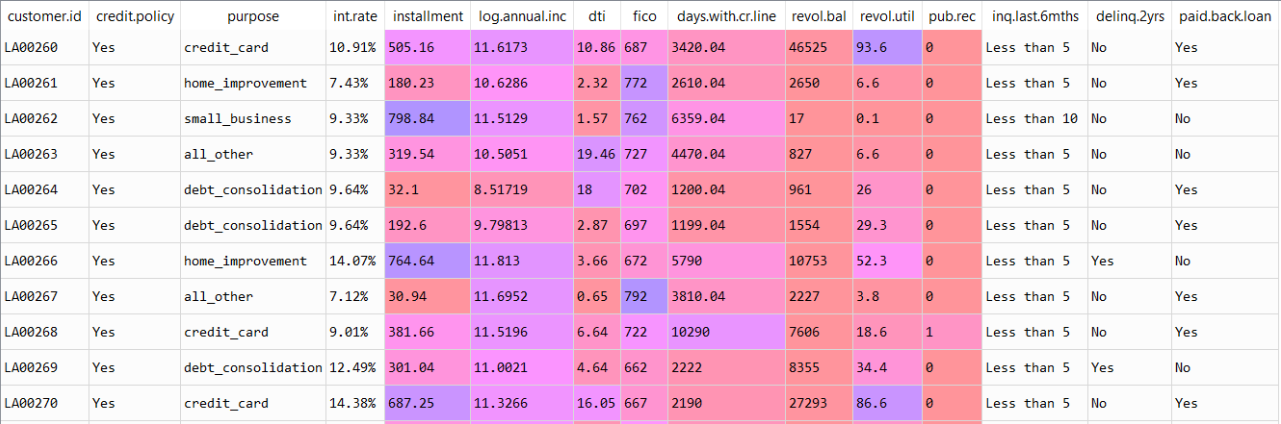
The snapshot of the data we will be working on:
| Feature | Description |
|---|---|
| customer.id | ID of the customer |
| credit.policy | If the customer meets the credit underwriting criteria of LendingClub.com or not |
| purpose | The purpose of the loan(takes values :“creditcard”, “debtconsolidation”, “educational”, “majorpurchase”, “smallbusiness”, and “all_other”). |
| int.rate | The interest rate of the loan |
| installment | The monthly installments owed by the borrower if the loan is funded |
| log.annual.inc | The natural log of the self-reported annual income of the borrower |
| dti | The debt-to-income ratio of the borrower (amount of debt divided by annual income) |
| fico | The FICO credit score of the borrower |
| days.with.cr.line | The number of days the borrower has had a credit line. |
| revol.bal | The borrower’s revolving balance (amount unpaid at the end of the credit card billing cycle) |
| revol.util | The borrower’s revolving line utilization rate (the amount of the credit line used relative to total credit available) |
| pub.rec | The borrower’s number of derogatory public records (bankruptcy filings, tax liens, or judgments) |
| inq.last.6mths | The borrower’s number of inquiries by creditors in the last 6 months |
| delinq.2yrs | The number of times the borrower had been 30+ days past due on a payment in the past 2 years |
| paid.back.loan | Whether the user has paid back loan |
Importing libraries
import pandas as pd
from sklearn.model_selection import train_test_split
import warnings
warnings.filterwarnings('ignore')
import matplotlib.pyplot as plt
import numpy as np
from sklearn.preprocessing import LabelEncoder
import seaborn as sns
from sklearn.tree import DecisionTreeClassifier
from sklearn.model_selection import GridSearchCV
Loading Dataset ,checking for null values
The first step - you know the drill by now - load the dataset and see how it looks like. In this task, we are basically looking for glimpse of overall data and look at the null values if they are present also some statistical representation of our data.
data = pd.read_csv('loan.csv')
data.head().T
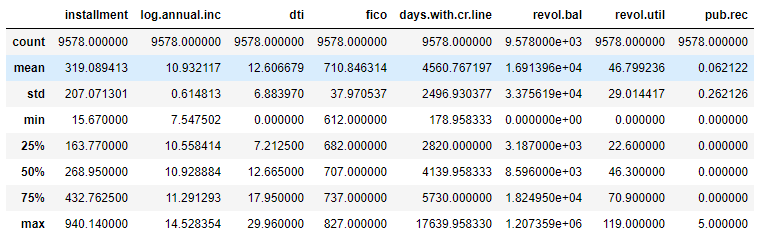
data.describe()
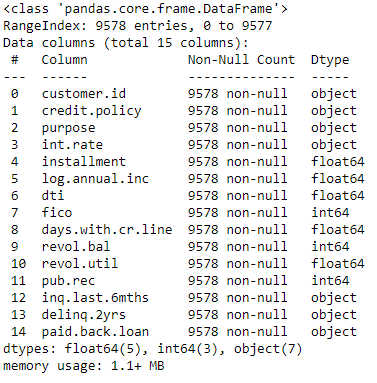
data.info()

Observation
We have no null values. We’ll drop the customer id, as it is of no use for our model and we have both numeric and categorical types of data which we will further preprocess.
Splitting the data
Let’s split the data into train and test
X = data.drop(['customer.id','paid.back.loan'], axis = 1)
y = data['paid.back.loan']
X_train,X_test,y_train,y_test = train_test_split(X,y,test_size=0.3, random_state = 0)
print(X_train.shape , y_train.shape)
print(X_test.shape, y_test.shape)

Target variable distribution
The distribution of “paid.back.loan” and plotting barplot.

Observation:
We can see that 5639 people have paid back loan while 1065 people not paid back the loan.
Feature Enginnering
We need to preprocess data beofre feature engineering as we can see that “int.rate” column has percentage symbol which need to be remove and later I am dividing that column with 100 to get the actual percentage values. After that I will be seperating the data into numeric and categorical dataframe.
#Removing the last character from the values in column
X_train['int.rate'] = X_train['int.rate'].map(lambda x: str(x)[:-1])

#Dividing the column values by 100
X_train['int.rate']=X_train['int.rate'].astype(float)/100

#Removing the last character from the values in column
X_test['int.rate'] = X_test['int.rate'].map(lambda x: str(x)[:-1])

#Dividing the column values by 100
X_test['int.rate']=X_test['int.rate'].astype(float)/100

#Storing all the numerical type columns in 'num_df'
num_df=X_train.select_dtypes(include=['number']).copy()

#Storing all the categorical type columns in 'cat_df'
cat_df=X_train.select_dtypes(include=['object']).copy()
Feature Visualisation
Now we can visualise the distribuiton of our numeric dataset in different calss variable. Below code will do the job
cols=list(num_df.columns)
for i in range(9):

    #Plotting boxplot
    sns.boxplot(x=y_train,y=num_df[cols[i]],ax=axes[i])

    #Avoiding subplots overlapping
    fig.tight_layout()

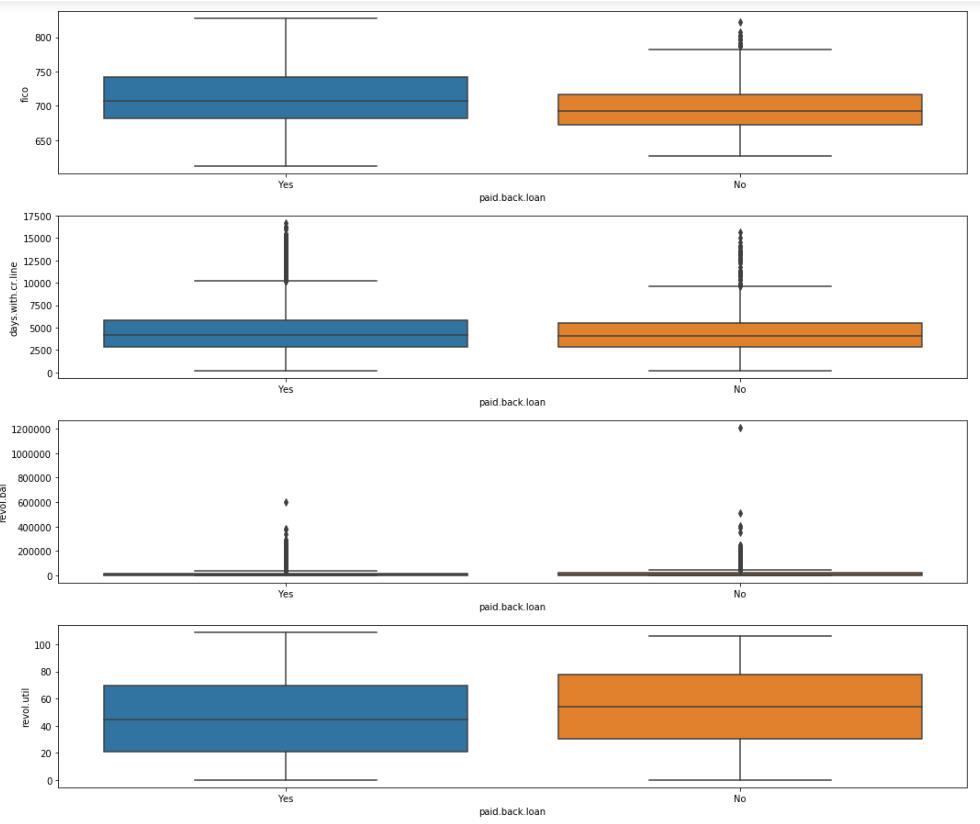
Observation:
Most of our features has different distribution for our class variable which is good for our model
Lets’s visualise the categorical features as well. I will be plotting using seaborn to see how our distribution differs in different class.
cols=list(cat_df.columns)
#Looping through rows
for i in range(0,2):

    #Looping through columns
    for j in range(0,2):

        #Plotting count plot
        sns.countplot(x=X_train[cols[i*2+j]], hue=y_train,ax=axes[i,j])

        #Avoiding subplots overlapping
        fig.tight_layout()
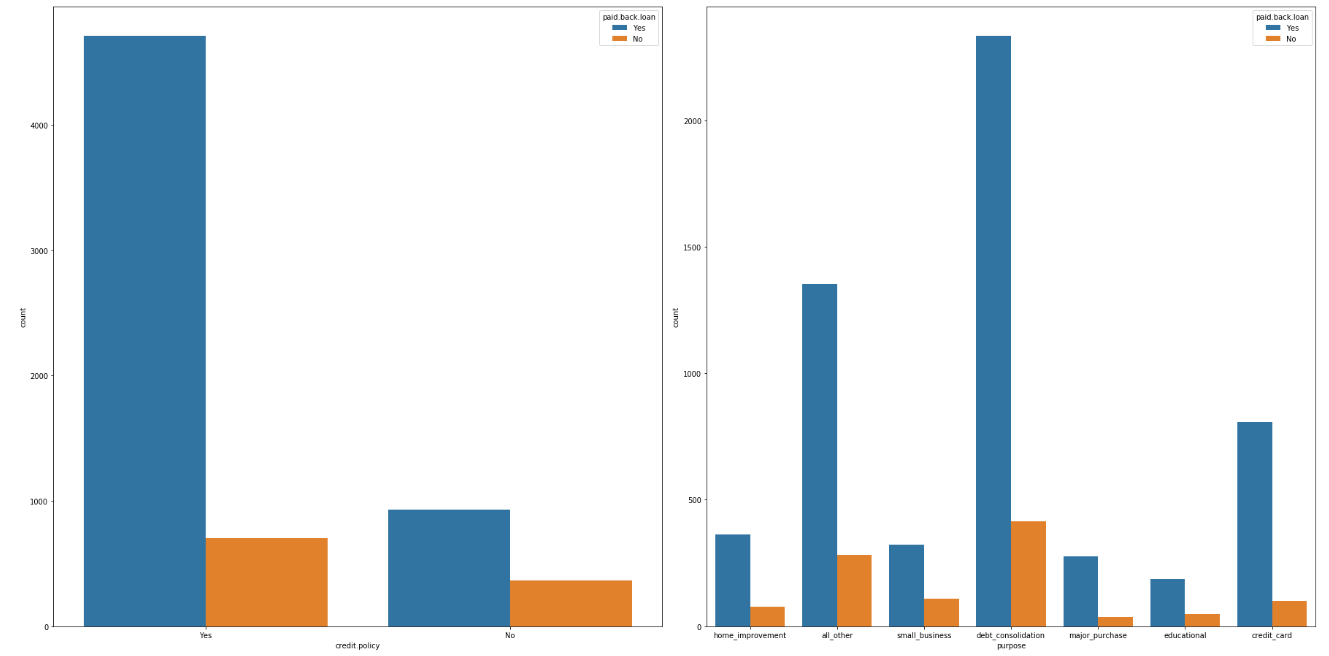
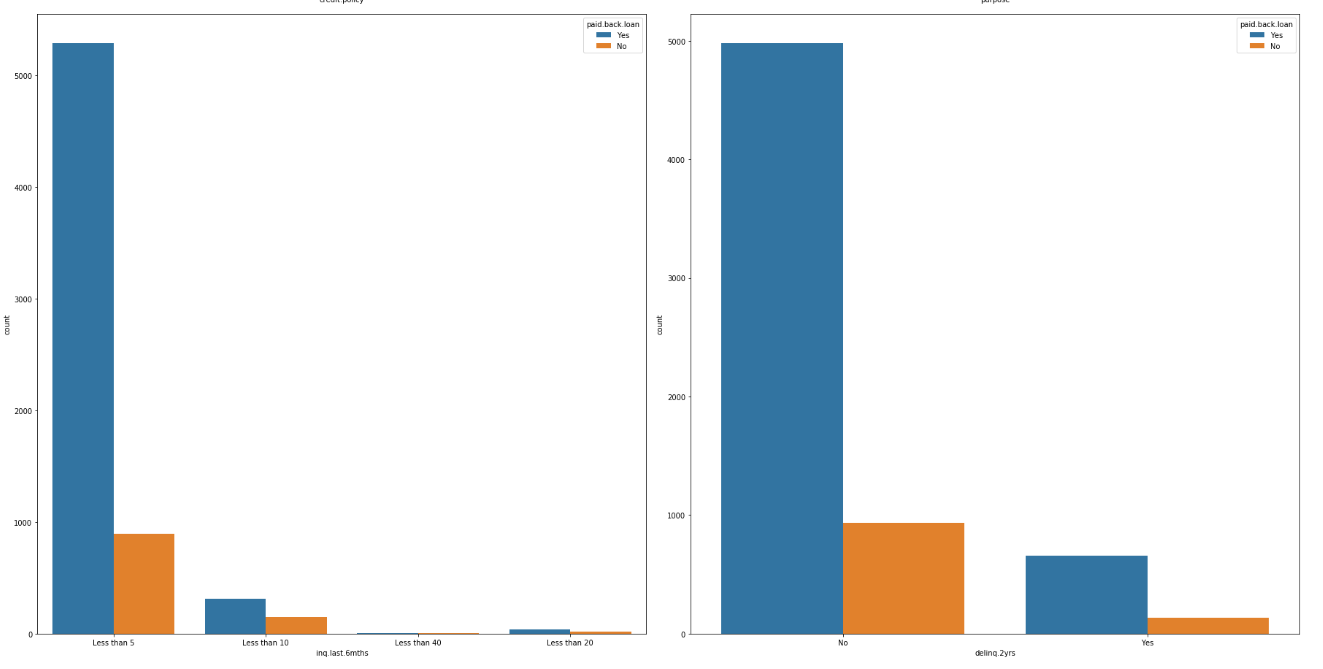
Observation:
We can see that the major reason that stands common for the majority of customers who have applied for a loan is debt_consolidation which means taking one loan to payoff there other loans.
1
Model Building
Let’s Apply the Decision Tree classifier to our dataset. We will encode the categorical features using label encoder.
for col in cat_df.columns:

    #Filling null values with 'NA'
    X_train[col].fillna('NA',inplace=True)

    #Initalising a label encoder object
    le=LabelEncoder()

    #Fitting and transforming the column in X_train with 'le'
    X_train[col]=le.fit_transform(X_train[col])

    #Filling null values with 'NA'
    X_test[col].fillna('NA',inplace=True)

    #Fitting the column in X_test with 'le'
    X_test[col]=le.transform(X_test[col])

# Replacing the values of y_train
y_train.replace({'No':0,'Yes':1},inplace=True)

# Replacing the values of y_test
y_test.replace({'No':0,'Yes':1},inplace=True)

#Initialising 'Decision Tree' model
model=DecisionTreeClassifier(random_state=0)

#Training the 'Decision Tree' model
model.fit(X_train, y_train)

#Finding the accuracy of 'Decision Tree' model
acc=model.score(X_test, y_test)

#Printing the accuracy
print(acc)

Observation:
We have total 74% accuracy on our model without having any hyperparameter tuning.
Decision Tree Pruning
Let’s see if pruning of decision tree improves its accuracy. We will use grid search to do the optimum pruning.
parameter_grid = {'max_depth': np.arange(3,10), 'min_samples_leaf': range(10,50,10)}

#Code starts here

#Initialising 'Decision Tree' model
model_2 = DecisionTreeClassifier(random_state=0)

#Applying Grid Search of hyper-parameters and finding the optimum 'Decision Tree' model
p_tree = GridSearchCV(model_2, parameter_grid, cv=5)

#Training the optimum 'Decision Tree' model
p_tree.fit(X_train, y_train)

#Finding the accuracy of the optimum 'Decision Tree' model
acc_2 = p_tree.score(X_test, y_test)

#Printing the accuracy
print(acc_2)
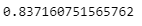
Observation:
Great our accuracy has improved drastically.
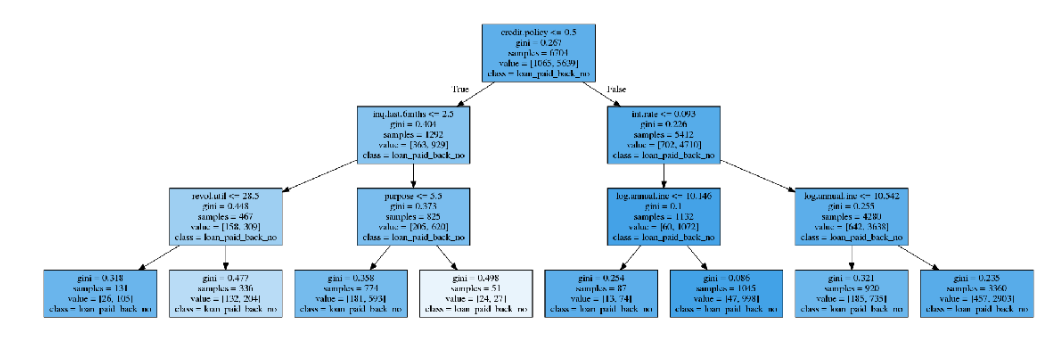
Tree visualising
we can also visualise our tree.
#Importing header files

from io import StringIO
from sklearn.tree import export_graphviz
from sklearn import tree
from sklearn import metrics
from IPython.display import Image
import pydotplus


#Creating DOT data
dot_data = export_graphviz(decision_tree=p_tree.best_estimator_, out_file=None,
                                feature_names=X.columns, filled = True,
                                class_names=['loan_paid_back_yes','loan_paid_back_no'])

#Drawing graph
graph_big = pydotplus.graph_from_dot_data(dot_data)

#Displaying graph
# show graph - do not delete/modify the code below this line

img_path = user_data_dir+'/file.png'
graph_big.write_png(img_path)

plt.figure(figsize=(20,15))
plt.imshow(plt.imread(img_path))
plt.axis('off')
plt.show()
Code and Data
Full Code and Dataset can be found here
Conclusion and Future Work
Congratulations if you have reached her :) We can try GBDT and XgBoost to increase our model accuracy.